From theoretical polling to four TRMNL panels on my desk
After comparing polling and webhook, I set up TRMNL for real with four e-ink screens rotating next to my monitor, powered by a FastAPI service on Dokploy. What each panel shows, the technical decisions hiding underneath, and a couple of things that didn't work on the first try.
A few days ago I compared the two possible ways to get the status of my VPS onto a TRMNL screen, polling a JSON endpoint or sending a webhook from the timers I already have. I went with polling, mostly because control over what shows up on the screen lives on my server, not on the device, and because it fit the idea of a "silent postcard" better than an immediate notification.
This week I built it for real. Four screens rotating every fifteen minutes next to my monitor, powered by a FastAPI service on the same Dokploy VPS. This post is what I ended up with, what each panel looks like, which decisions took more work than they seemed to, and a couple of things that didn't work on the first try.
The skeleton, without overengineering
The backend is a small FastAPI app with four endpoints, one per screen. Each one returns plain JSON that TRMNL renders with a Liquid template pasted into its Private Plugins UI. The screen polls every N minutes, gets the JSON, renders the Liquid, and leaves the result on e-ink. There's no state on the device. If I want to change what's shown, I edit the endpoint and the next refresh applies it.
The service runs as just another project in Dokploy, behind Traefik with its own domain, a Let's Encrypt certificate, and a rate limit middleware set to 60 req/min per IP. TRMNL requests carry a 256-bit bearer token that's checked with hmac.compare_digest, and the origin only accepts TLS signed by Cloudflare through Authenticated Origin Pull. If someone tries to talk directly to the VPS without going through CF, the handshake fails before it ever reaches the backend.
The code for each screen ends up being almost declarative. The endpoint builds a screen from one or more collectors (host, traefik, dokploy, umami, docker, crowdsec), and the collectors are the only part with any real logic. The idea is to be able to add a new screen without touching anything that's already working.
Overview, the first thing I look at
The default screen is the general summary. Four big numbers at the top (CPU, RAM, disk, uptime) and a list of services with their latency and the status of the latest deploy.
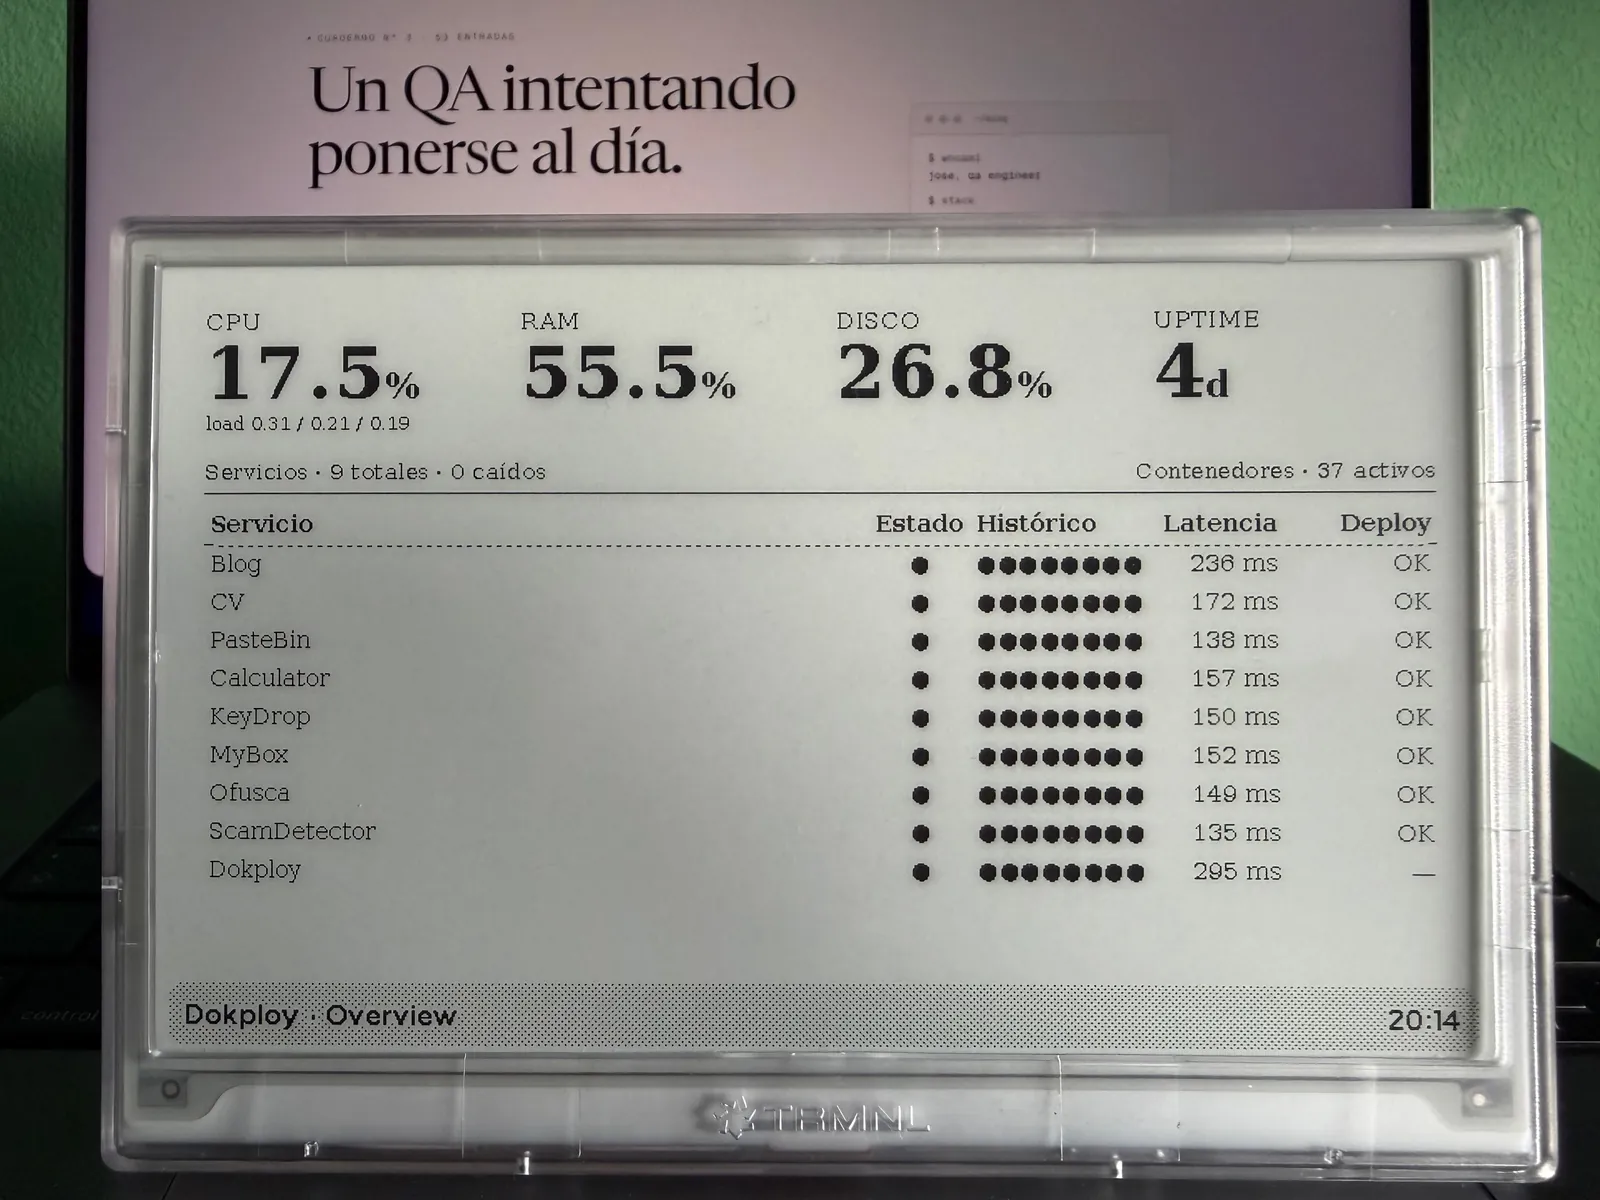
I get the host part with psutil inside a separate thread, because cpu_percent(interval=1) blocks for a full second while sampling, and I don't want FastAPI's event loop to stall on every refresh. The services part comes from a collector called service probes, which does a HEAD request to each configured URL and measures latency. The service list comes from an env var with inline JSON, so adding a new one is just editing the variable in Dokploy and redeploying. No rebuild needed.
The "latest deploy" column is the only one that needs to authenticate against the Dokploy API with a token. I count finished deploys with no error as OK, running ones as deploy, and failed ones as fail. If the Dokploy API doesn't respond, that column stays blank and the rest of the panel keeps working. That's deliberate, no collector should take down the whole screen.
Resources, when I want the details
Overview fits in a quick glance, but sometimes I want to know which container is chewing through CPU. That's what Resources is for, with CPU, RAM, and disk bars, swap, network, and a top list of containers sorted by usage.
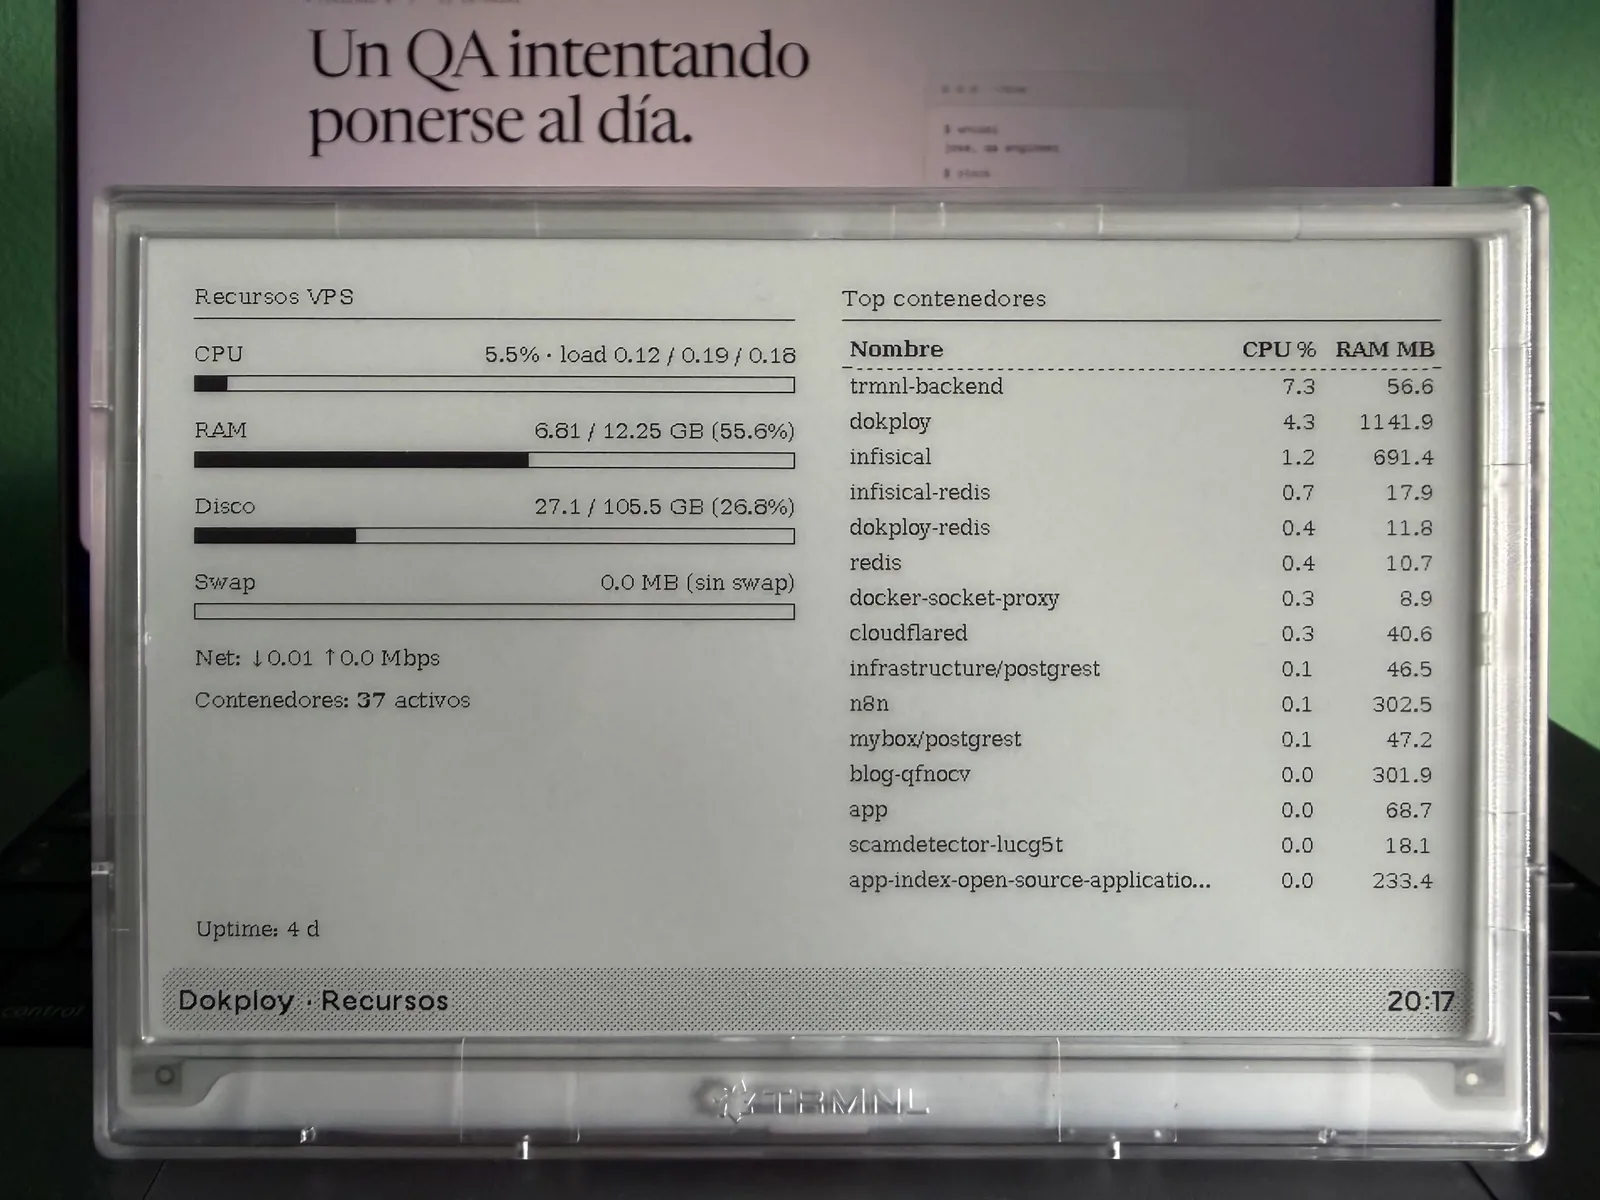
The container details come from the Docker Engine HTTP API, not directly from the socket. Between the backend and Docker there's a wollomatic/socket-proxy with an allowlist regex limited to /containers/json and /containers/{id}/stats. The /containers/{id}/json endpoint is deliberately blocked with 403, because that one does expose environment variables from other containers and I don't need it at all for this panel. Defense in depth, if the backend ever gets compromised, I don't give it any more surface than it absolutely needs.
The first versions of Resources showed the full name of each Swarm task (something like blog-qfnocv.1.o3ywn067fsw6e5ltw776et19t), which fit badly in the table and didn't tell me anything useful. Now the collector resolves the Compose service name through the com.docker.compose.service label and only falls back to the long id if it doesn't exist. If the same name appears in two different projects (which is what happens with postgrest), it's disambiguated with the project prefix, infrastructure/postgrest and mybox/postgrest. I also hide the mem_limit_mb column when it matches the host's total RAM, because that means the container has no limit and the value just adds noise.
One thing that took me a while to figure out, the socket-proxy image is distroless, it doesn't include wget or curl inside, so I can't give it a healthcheck that validates its API. Every now and then it hangs without warning and the screen shows up with an empty container table. The fix is crude, manually restarting the container over SSH, but it's documented and so far I haven't had more than one episode every couple of weeks. If it starts happening regularly I'll switch it for a variant with a minimal shell, even if that means giving up some of the hardening.
Traffic, reading Traefik's access.log raw
Traffic is the screen with the most hidden technical decisions. It shows rpm, 5xx errors in the last fifteen minutes, p95 and p99 latency, active firewall bans, and two columns with top domains and latest deploys.

The source for everything traffic-related is Traefik's access.log in JSON format. My first thought was to bring in Loki or Prometheus, but the blog makes no money that would justify moving one more piece. The second was to parse the whole log on every request, which scales badly but works on a small VPS. The third, which is what I left in place, is to read only the last two megabytes of the file (a seek to the end, then read backwards), discard the first line in case it got truncated, and filter by a fifteen-minute time window. On a VPS with low average rpm that's fewer than 30000 entries, I parse them as JSON or CLF, calculate p50, p95, and p99 with statistics from the stdlib, group by host, and I'm done.
One funny little quirk that started showing up in the top domains once I set up TRMNL is the panel backend itself. Since each screen makes one request every fifteen minutes and there are four screens, it keeps up a small but steady flow. Seeing myself on the screen reminding me that the screen works is kind of funny.
The "active bans" column comes from CrowdSec, calling its Local API with the bouncer key. I got myself tangled up here too, ban events in the last 24 hours and active bans right now are two different things. What I wanted to see on the screen was the second one, "there are 47 blocked IPs right now", not "someone got banned today". I had to change the query from /v1/alerts to /v1/decisions?type=ban and filter out the ones that have already expired. It sounds like a small detail, but it can easily eat half an hour if you're doing it the hard way. Besides the global number, the bottom right also shows a specific SSH bans counter, because it's useful to know whether the noise is coming from the web layer or from people trying to log into the port.
Blog, Umami through the database instead of the API
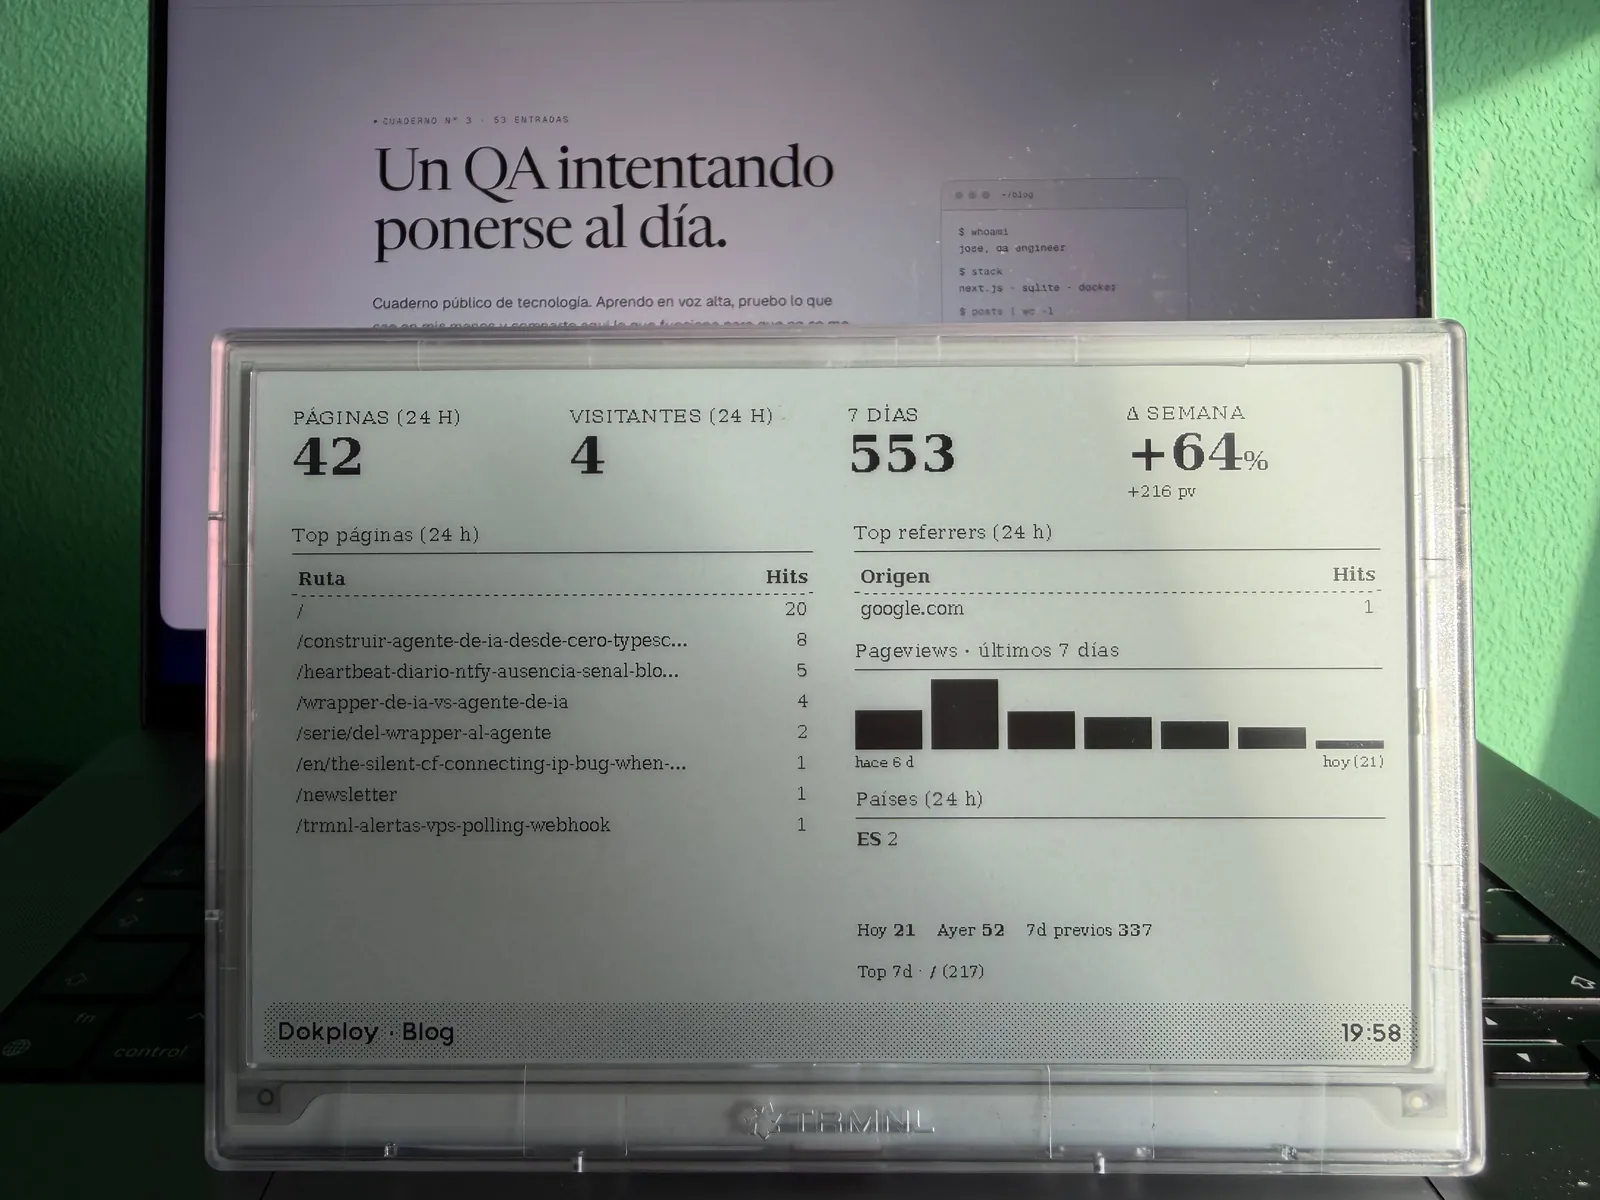
The fourth screen is for the blog itself, with page views and unique visitors in 24 hours, a comparison against the previous week, and the two most useful columns, top pages and top referrers.
For web traffic data I use Umami, which I already have self-hosted. The official API requires doing POST /api/auth/login with an admin username and password, getting a token back, and rotating it. For a read-only panel living inside the same Docker network, that felt like too much, so I took the short path, connecting directly to Umami's Postgres database with a umami_ro role that only has SELECT on three tables (website_event, website, and session). No admin password, no tokens to rotate, no sessions.
The cost is that I'm coupling myself to Umami's internal schema, which is a living project and any major migration could rename columns. Accepted and documented, in the worst case I lose the screen for a while until I update the query. In return, the four main metrics, the two top lists, and the countries table come out of one or two queries and get cached for 60 seconds so I don't hammer the DB.
A week after getting the screen up and running I added a daily sparkline for the previous seven days next to the tables. The visual shape tells you faster than the percentage whether traffic is trending up, whether it's just carrying the momentum from an isolated spike, or whether it's been flat for three days. Umami's query only counts what happened between two timestamps, it doesn't remember yesterday, so I added persistence in the backend, a small JSON file in a /data volume that stores the daily snapshot at a fixed time. The sparkline reads from that file and the weekly delta becomes absolute as well as percentage-based (+216 pv gives a lot more context than just +64%).
The screen also shows, at the bottom right, the breakdown for today, yesterday, and the previous seven days, along with the most-read page from the last seven days. It helps put the delta in context, "+64% over 337" is not the same thing as "+64% over 4". The countries block uses two-letter ISO codes directly, untranslated, because the screen is narrow and "ES 2" fits where "Spain" doesn't. These are UI decisions that only make sense after you've spent a week looking at the panel and missing the data.
Security, just in case
The backend doesn't expose /docs, /redoc, or /openapi.json, no need for that either. The 256-bit bearer token is checked with hmac.compare_digest, not == (constant time, no side channel). The process runs as USER 1001, with cap_drop ALL, no-new-privileges, read_only, and a minimal tmpfs on /tmp. Images are pinned by digest, uv.lock is committed, and UV_NO_BUILD=1 prevents arbitrary wheel builds from sdist during the build. Dependency bumps go through a script with a 48-hour quarantine, equivalent to the minimum-release-age I use in pnpm for the blog.
There's one accepted risk that's worth naming, the container joins dokploy-network, the same internal network shared by the Dokploy DB, Infisical, and all the apps in my projects. If the TRMNL backend ever suffered an RCE, the attacker would have network visibility into those services. It's mitigated by all the earlier barriers and by the Cloudflare layer in front with rate limiting on cf-connecting-ip and the CrowdSec bouncer, but it's worth knowing this is a risk inherent to Dokploy's shared-network design. It's not a stain you can scrub away, it's a decision.
What didn't make it into the first version
I wanted to add a dedicated screen for security alerts (AIDE events, SSH attempts, 4xx spikes by IP) but once I mocked it up I realized I was duplicating the role of the Telegram bot and the ntfy pushes with a daily heartbeat. If an intrusion is happening, I don't want to wait fifteen minutes for the screen to refresh, I want a priority-five notification on my phone. TRMNL keeps its role as a "silent postcard", not an incident channel.
I also considered a finance panel (broker account, positions, rate alerts) and a home panel (weather, upcoming calendar events). I have those in mind for the next round. The nice thing about TRMNL Private Plugins is that each one is independent, I can add endpoints without touching the ones that are already up and running.
The day after deploy
I've had the device on next to my monitor for four days now. I look at it a couple of times per session, almost without noticing. When everything is green, I glance over and keep working. The day I saw a 5xx on Traffic I checked the log and it turned out to be a bot trying routes that don't exist. No real action needed, but the screen did its job, it nudged me to look.
The pattern of "I'll go look for the information" has turned into "the information is where I can see it without effort". Which is exactly what I wrote in the previous post before hitting the buy button. This time the decision and the implementation lined up, which doesn't always happen.

Jose, author of the blog
QA Engineer. I write out loud about automation, AI and software architecture. If something here helped you, write to me and tell me about it.
Leave the first comment
What did you think? What would you add? Every comment sharpens the next post.
If you liked this

Un TRMNL para las alertas del VPS, polling o webhook
Estoy valorando llevar las alertas de mi infraestructura a una pantalla de e-ink TRMNL. Comparo los dos caminos posibles, polling con un endpoint JSON detrás de Cloudflare Access y webhook desde los timers que ya tengo.

OpenClaw para testing y QA: automatiza lo que antes hacías a mano
OpenClaw no solo sirve para verificar integridad: regresión visual, monitorización de endpoints, análisis de logs, smoke tests post-deploy y auditoría de seguridad continua. Casos de uso reales para testing y QA.

Cómo montamos la infraestructura con Dokploy (y por qué dejamos Vercel)
Un VPS, Docker, Traefik y Dokploy. Así alojamos el blog y diez proyectos más. Por qué dejamos Vercel, por qué elegimos Dokploy sobre Coolify y qué ganamos y perdimos en el camino.